
Project brief
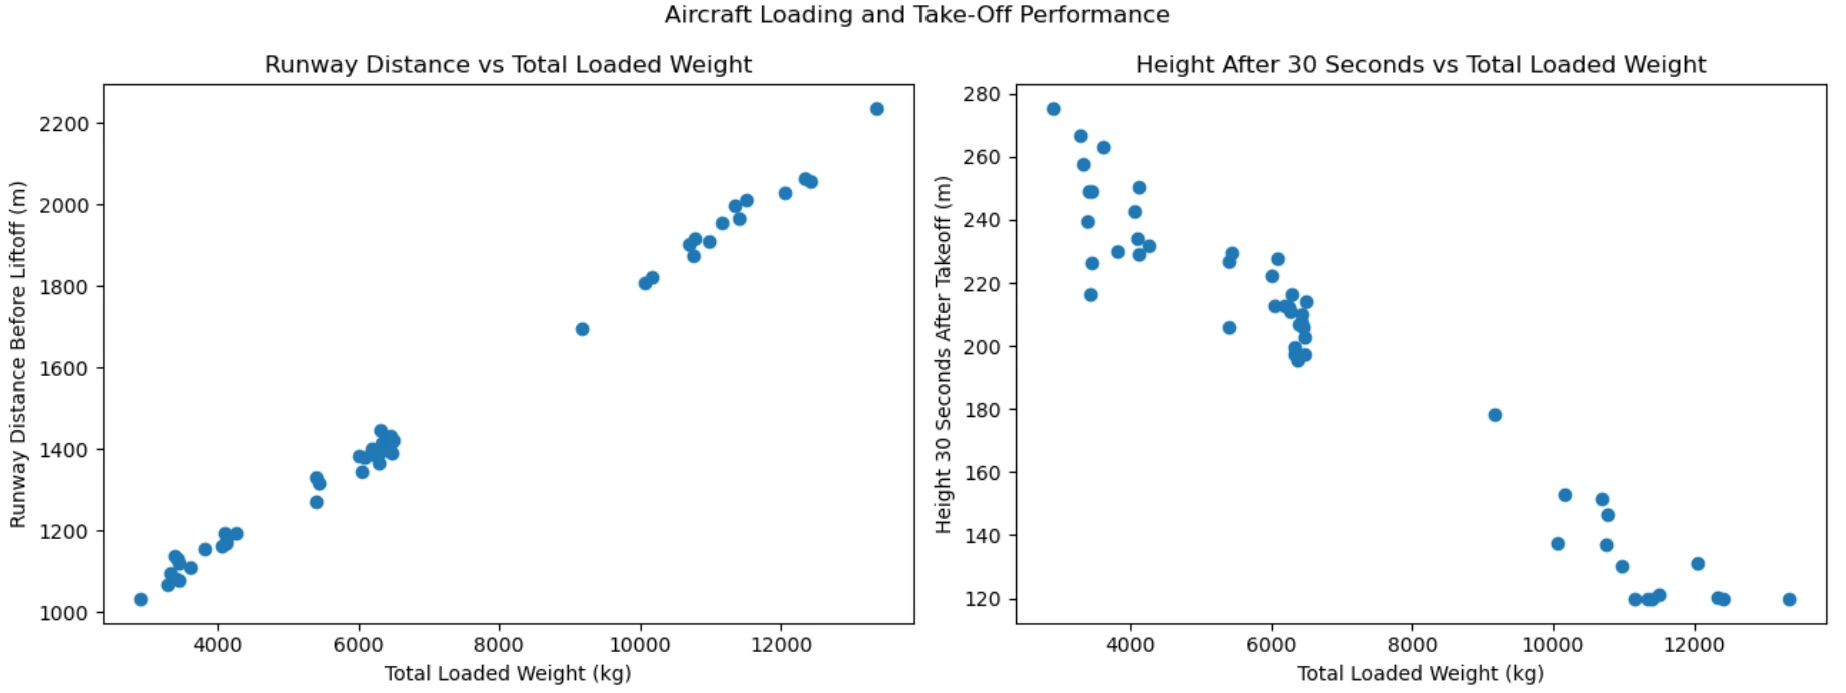
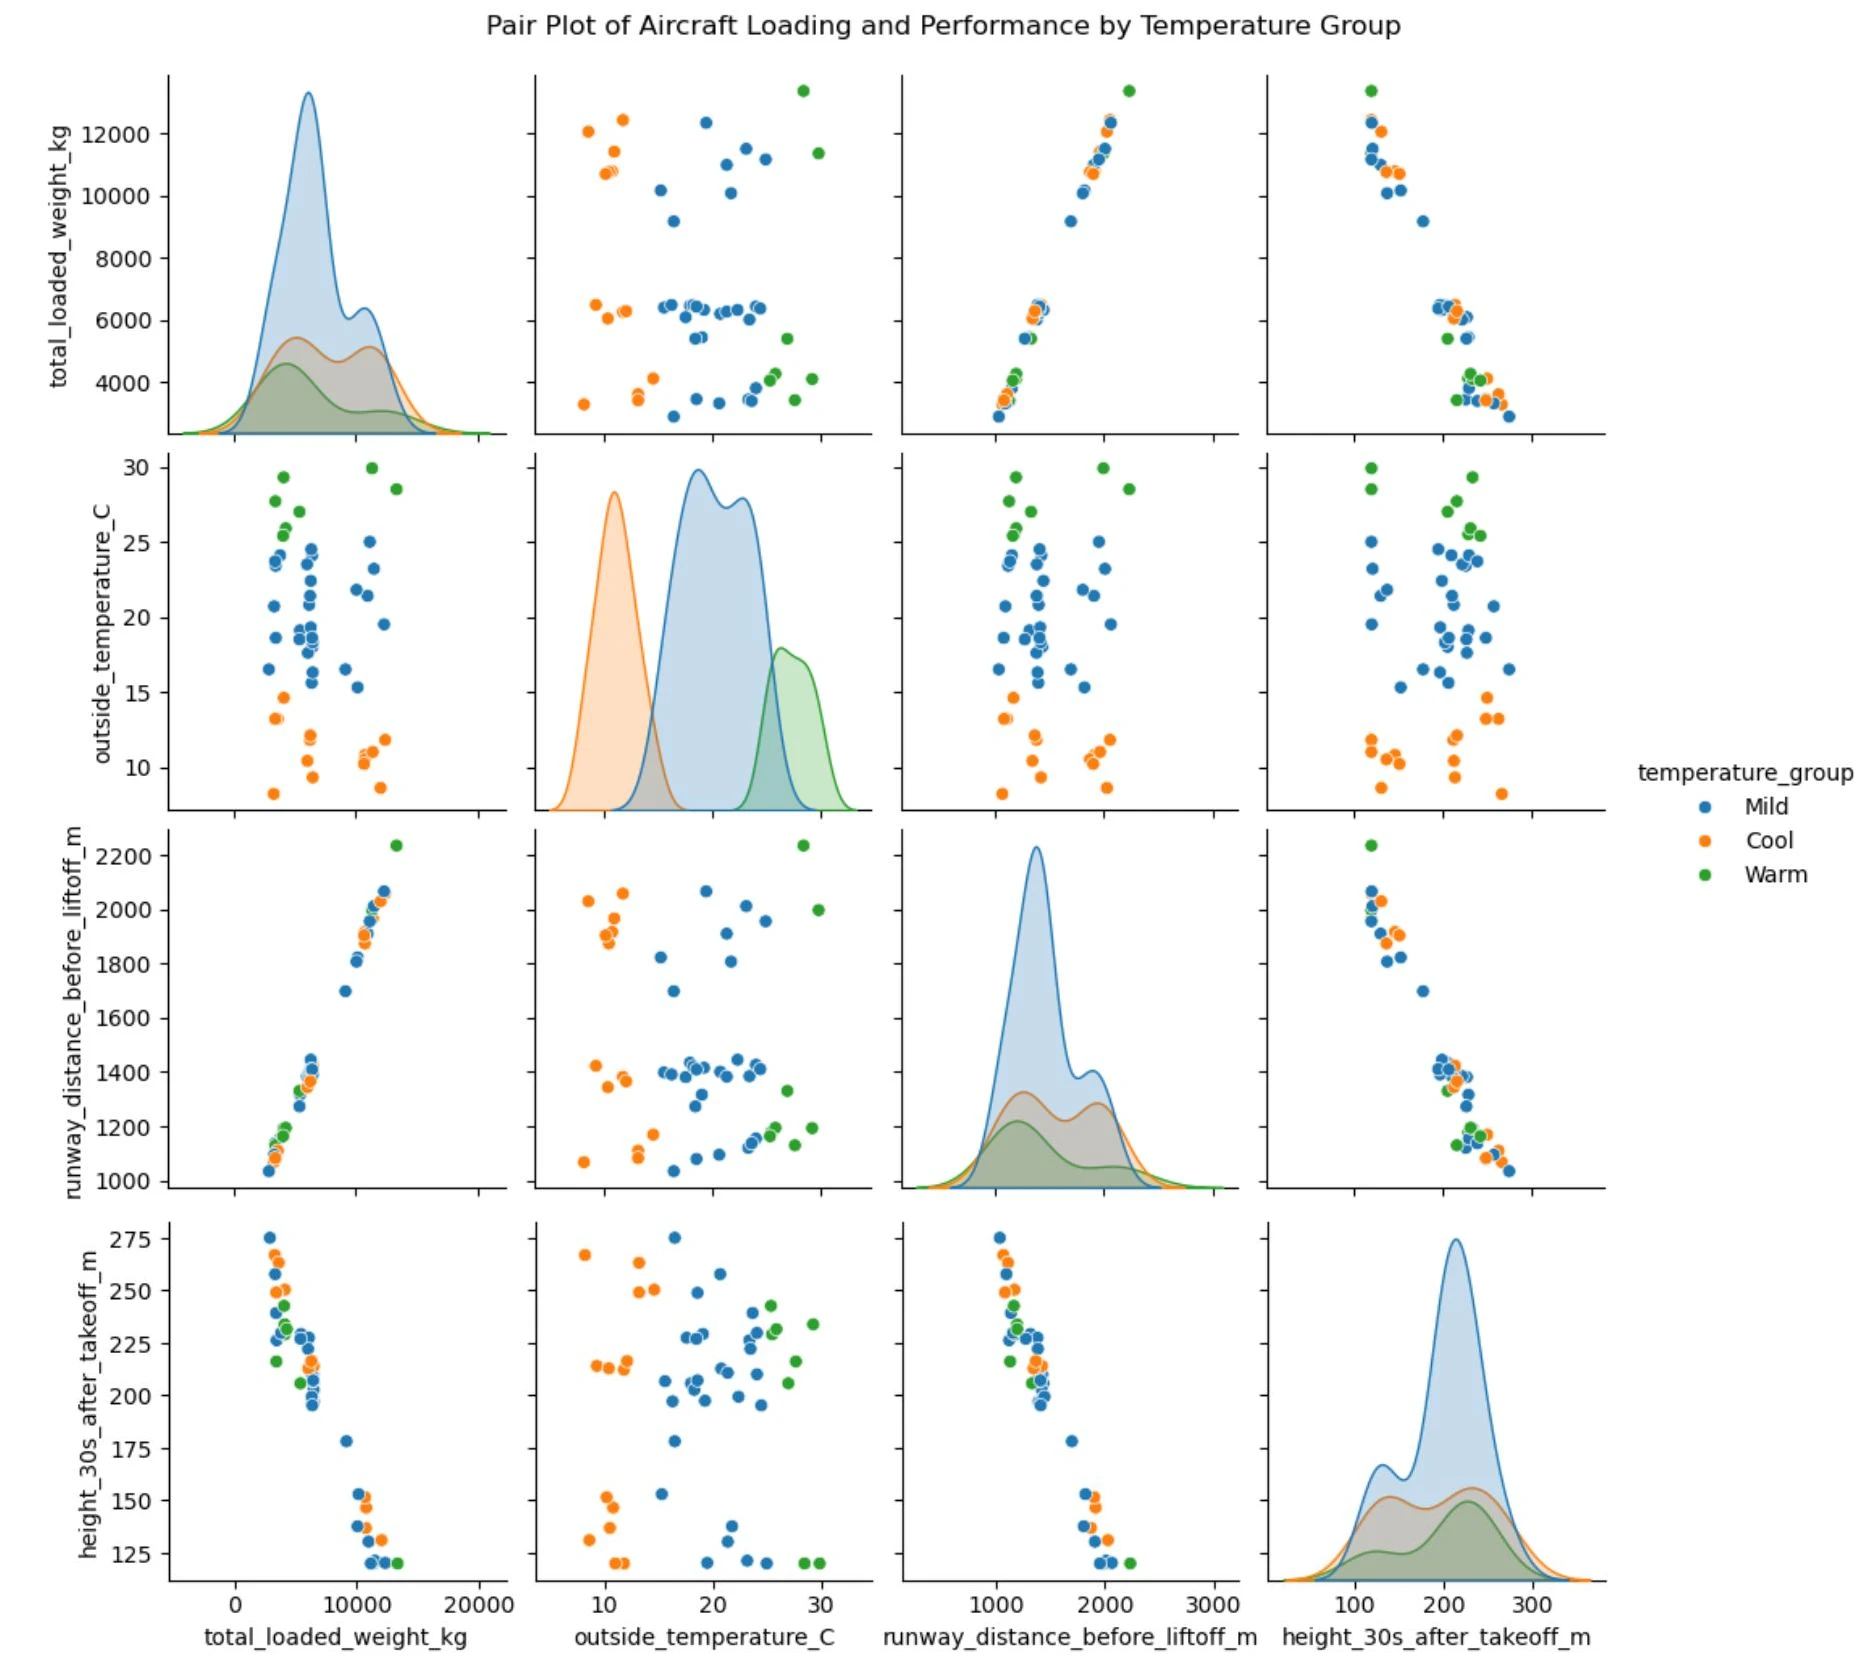
This project uses a simplified passenger-aircraft dataset to demonstrate a complete Python data-analysis workflow. Each flight contains occupied seats, luggage and fuel mass, outside temperature, runway distance before liftoff and height after 30 seconds. A derived load variable combines passenger mass under a stated 75 kg-per-seat assumption with luggage and fuel. The implementation loads and inspects the CSV, calculates descriptive statistics and assigns categorical groups for loading and temperature. Matplotlib scatter plots compare loaded weight with runway distance and early climb height, while Seaborn provides a loading-class count chart and a multivariate pairplot. A simple linear model is fitted with NumPy to estimate runway distance from total loaded weight, and the report records a worked prediction for a 6,000 kg loading case. The figures show a positive association between weight and runway distance and a negative association with early climb height within this teaching dataset. The work demonstrates readable code structure, derived features, visual exploration and basic regression. Its results describe the supplied simplified data and do not establish a validated aircraft performance model.
The engineering challenge
Transform flight-level measurements into clear load categories, interpretable visual comparisons and a simple predictive model while preserving the dataset’s simplifying assumptions.
Engineering approach
- Load the CSV with exception handling and inspect its shape, columns and first records.
- Compute total loaded weight using the stated passenger-mass assumption and summarize performance measures.
- Assign loading classes and temperature groups with explicit threshold rules.
- Create scatter plots, a count chart and a temperature-colored pairplot.
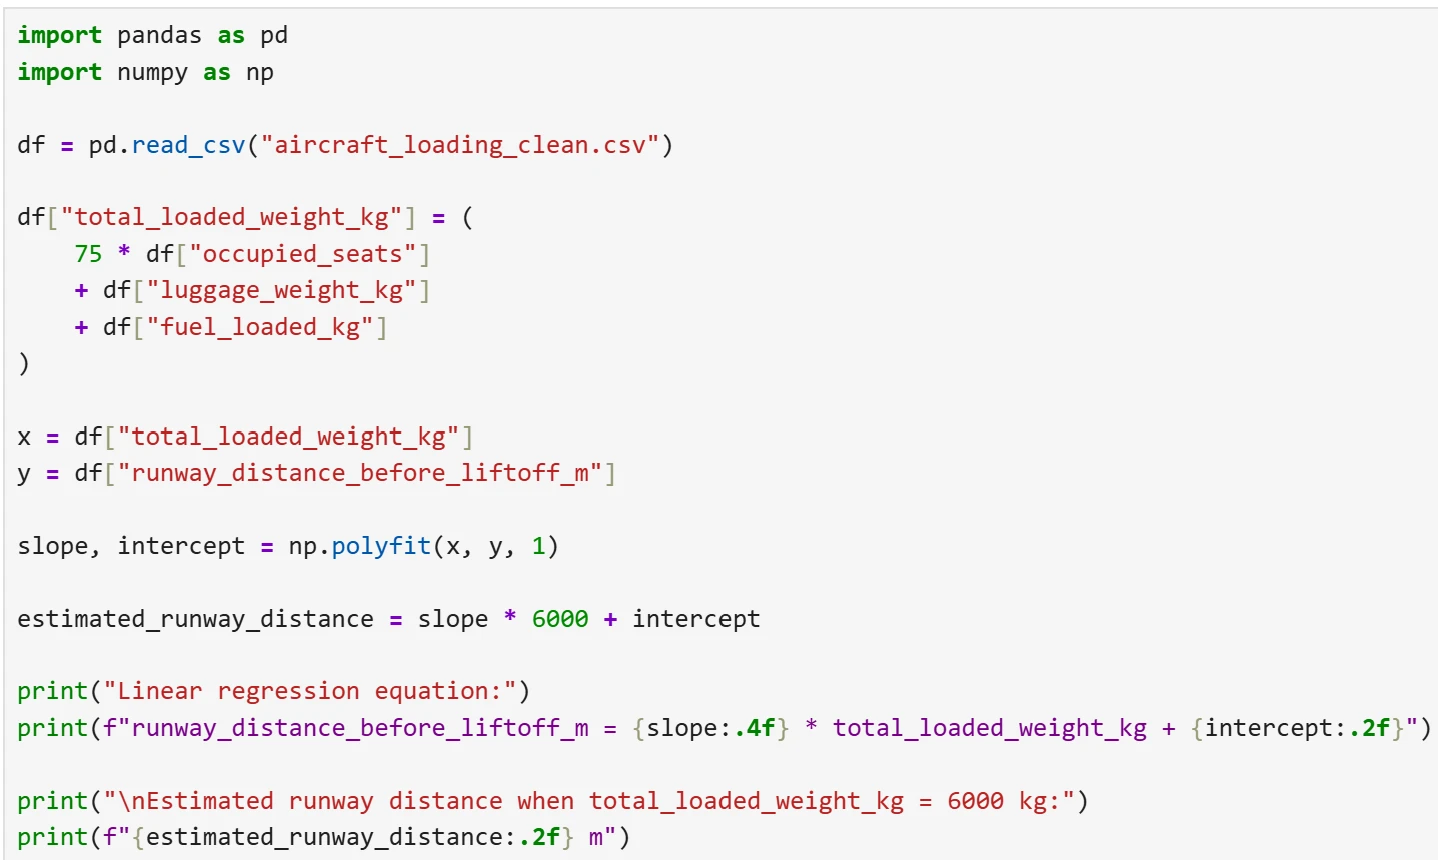
- Fit a first-order polynomial model and estimate runway distance for a specified loading case.
Results & observations
The source inspection output reports 50 rows and seven original columns.
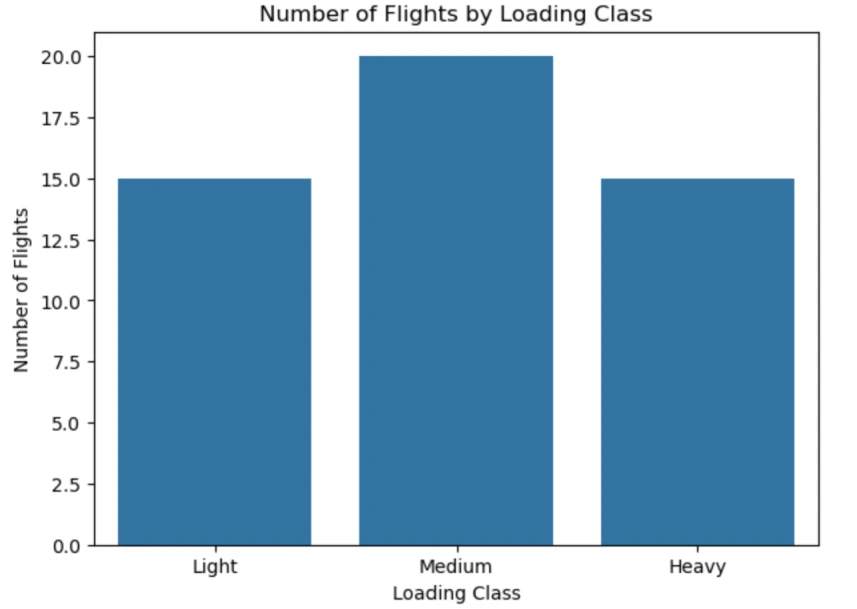
Counts for light, medium and heavy loading classes respectively.
Descriptive statistic reported for the supplied flight dataset.
Reported fitted-model estimate at 6,000 kg total loaded weight; the displayed equation rounds its coefficients.
Features & capabilities
- CSV loading and exception handling
- Derived passenger and payload mass
- Threshold-based grouping
- Descriptive statistics
- Multivariate plotting
- Simple linear regression
Software & engineering tools
Python, pandas, NumPy, Matplotlib, Seaborn