
Project brief
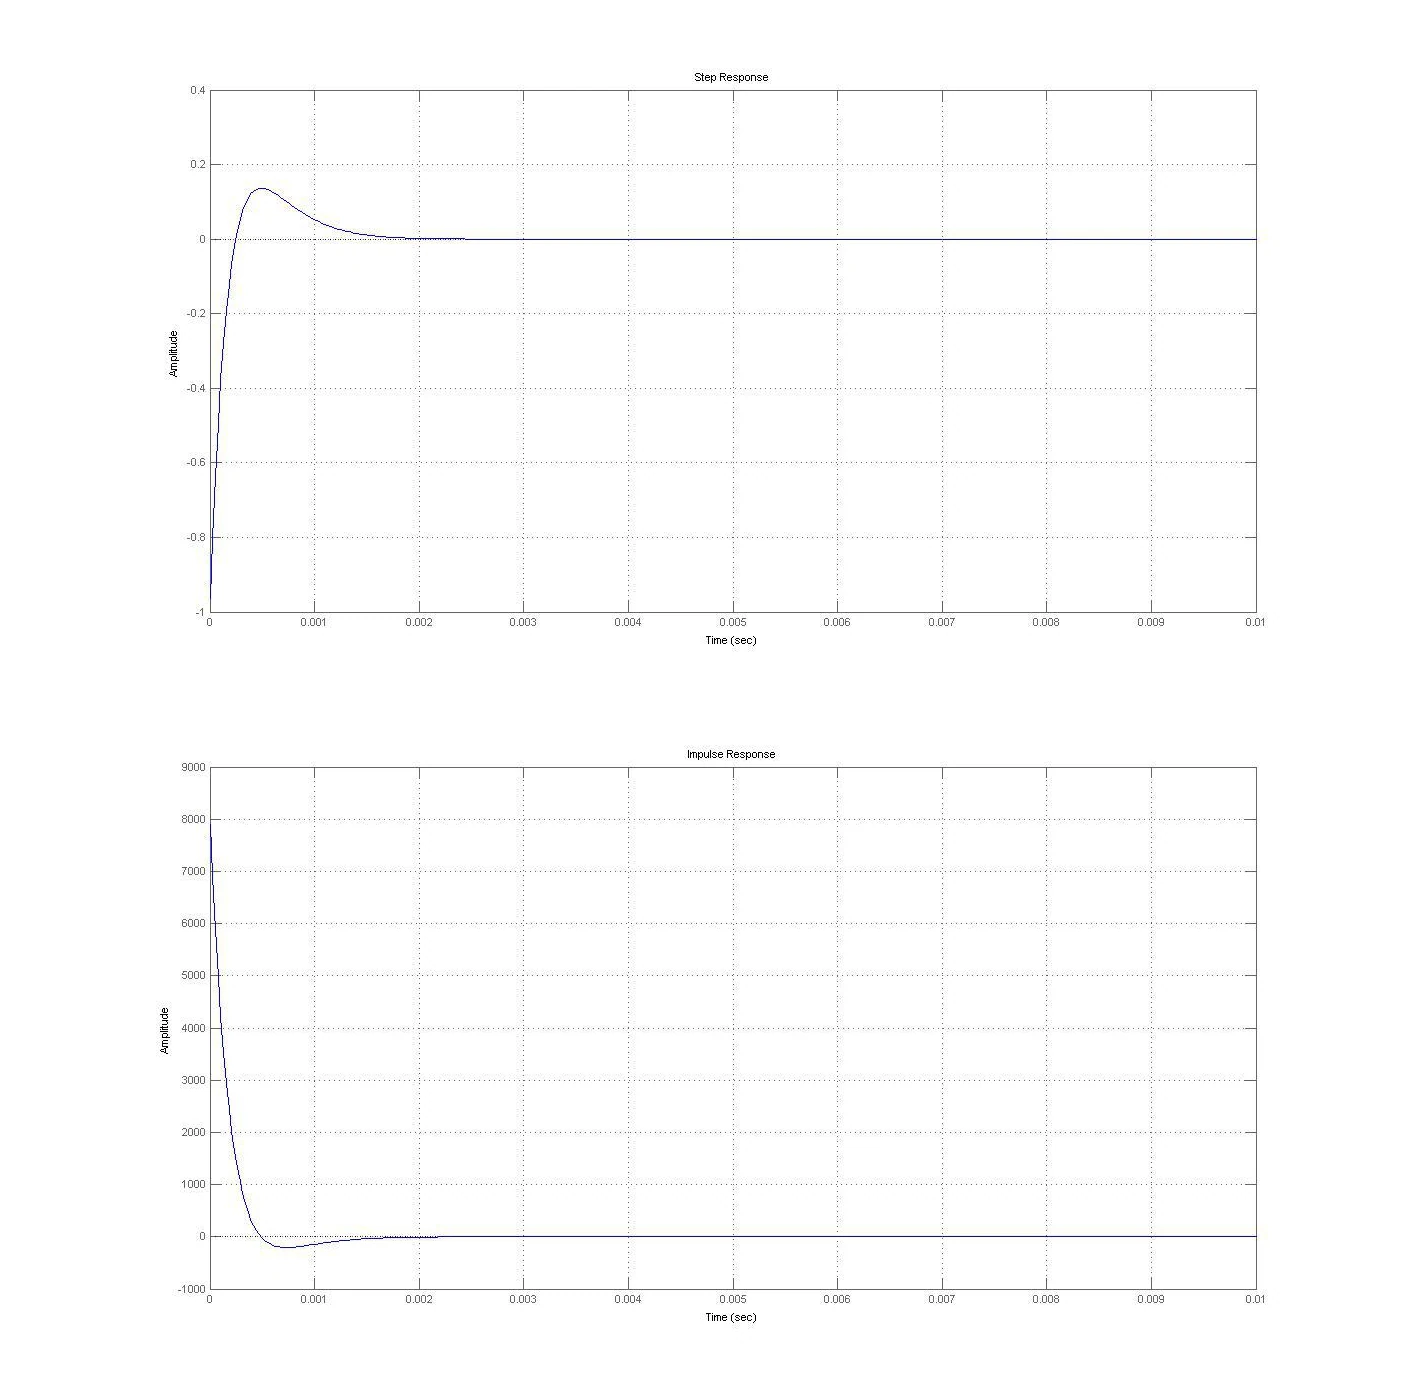
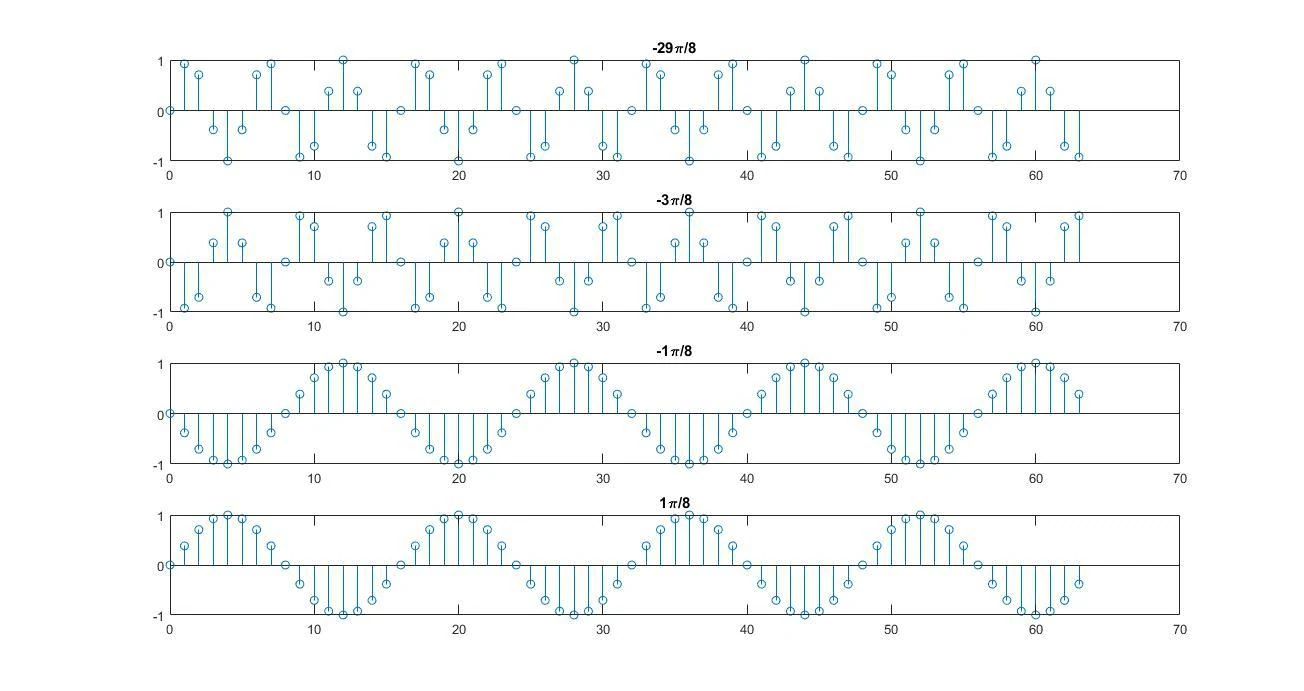
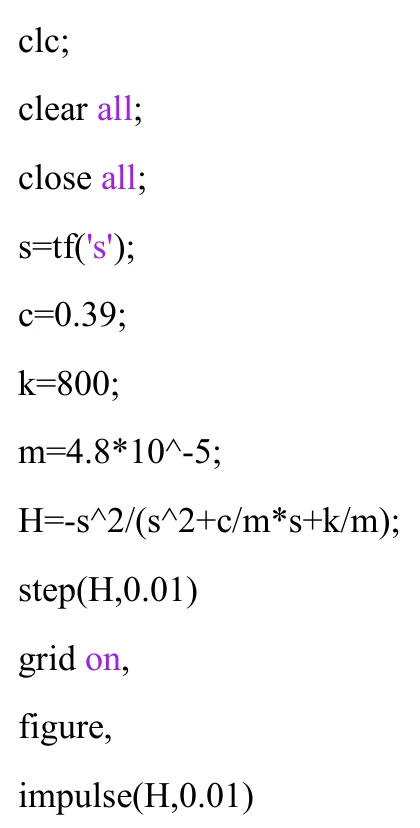
This project brings together mathematical system modeling and several MATLAB signal-visualization exercises. It begins with a spring–mass–damper representation of a vibration sensor and introduces relative displacement between the moving mass and its base. The report develops the governing equation and a transfer-function form, then supplies MATLAB code using tf, step and impulse to examine a specified parameter case over a 0.01-second interval. The documented parameters include a mass of 4.8 × 10⁻⁵ kg and spring stiffness of 800 N/m. Later exercises broaden the work to discrete-time impulses, delayed sequences, unit steps and sampled sinusoids. A set of stacked plots compares sinusoidal sequences for several angular-frequency choices, making the change in sample pattern visible. Continuous-time complex exponential examples then separate real, imaginary, magnitude and phase components; the damped example uses an exponentially decaying envelope. The project’s useful evidence is its progression from mathematical expressions to executable MATLAB statements and labeled plots. The selected gallery preserves that progression with the transfer-function code, transient response plots, sampled-sinusoid comparisons and complex-signal output. Some frequency-analysis calculations and interpretations in the source are inconsistent, so this brief does not claim a verified sensor bandwidth or optimal damping choice. It presents the supported modeling and plotting workflow without extending the report into experimental sensor validation.
The engineering challenge
Translate mechanical and signal equations into MATLAB representations while keeping continuous-system response plots and discrete-time sequence examples understandable.
Engineering approach
- Represent relative motion in a spring–mass–damper sensor and formulate the transfer function.
- Define the stated parameter case in MATLAB and plot step and impulse responses.
- Generate discrete impulses, step sequences and sampled sinusoidal signals with explicit time indices.
- Compare sinusoidal sample patterns across multiple angular-frequency settings.
- Plot the components of complex exponentials, including an example with exponential amplitude decay.
Results & observations
The MATLAB model uses spring stiffness k = 800 N/m and damping coefficient c = 0.39 as documented.
The provided code calls step and impulse for the stated model over this interval.
The report supplies MATLAB code and stem plots for these sequence families.
The supplied MATLAB code evaluates the complex exponential from 0 to 4 seconds.
Features & capabilities
- Mechanical transfer-function model
- Step and impulse plotting
- Discrete-time stem plots
- Frequency-parameter comparisons
- Complex signal decomposition
- Damped exponential visualization
Software & engineering tools
MATLAB, Control System Toolbox functions, tf, step, impulse, stem, real / imag / abs / angle