Project brief
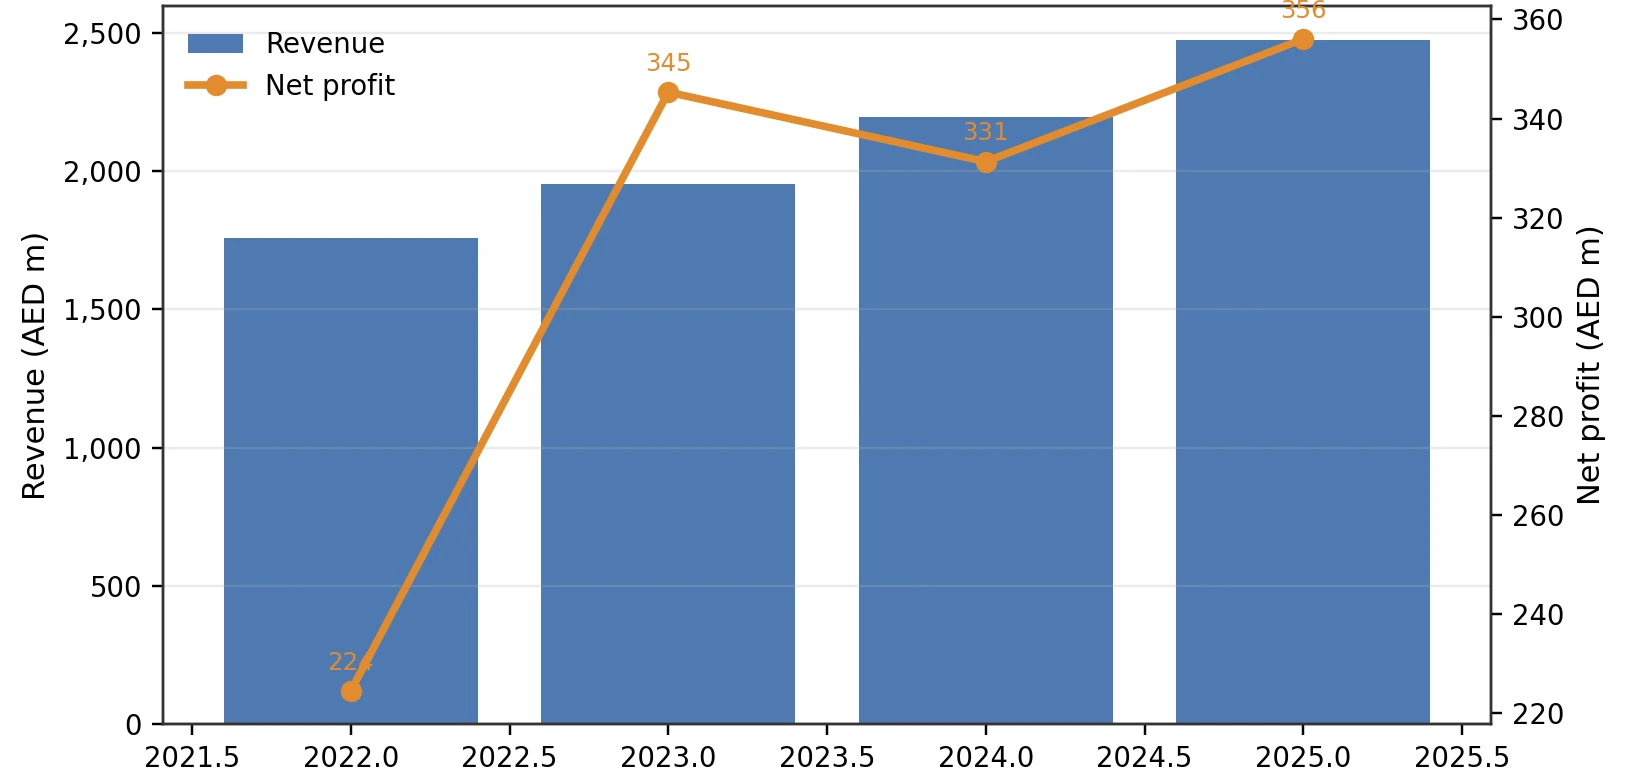
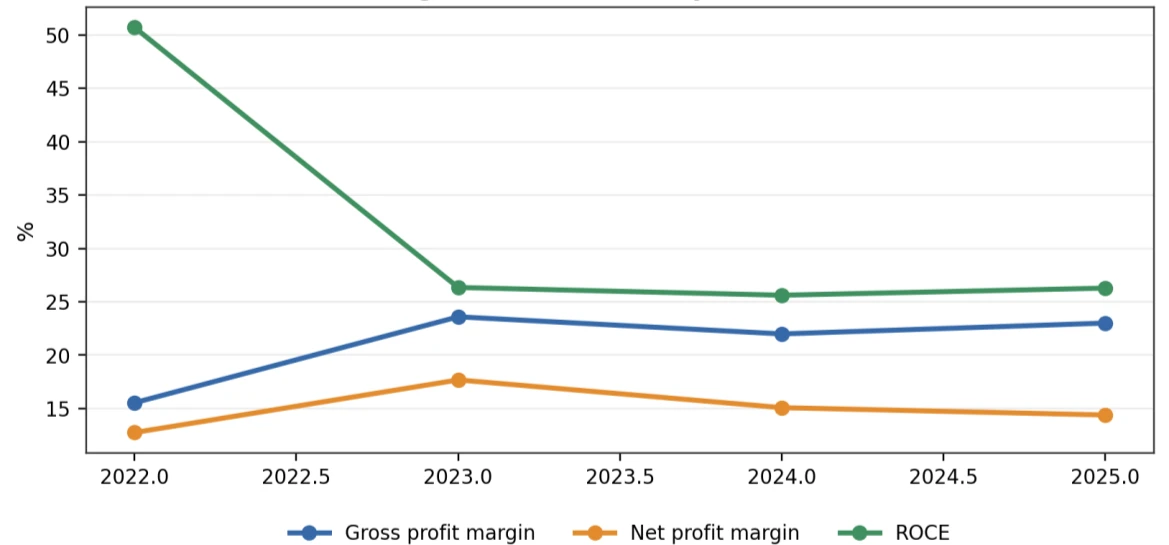
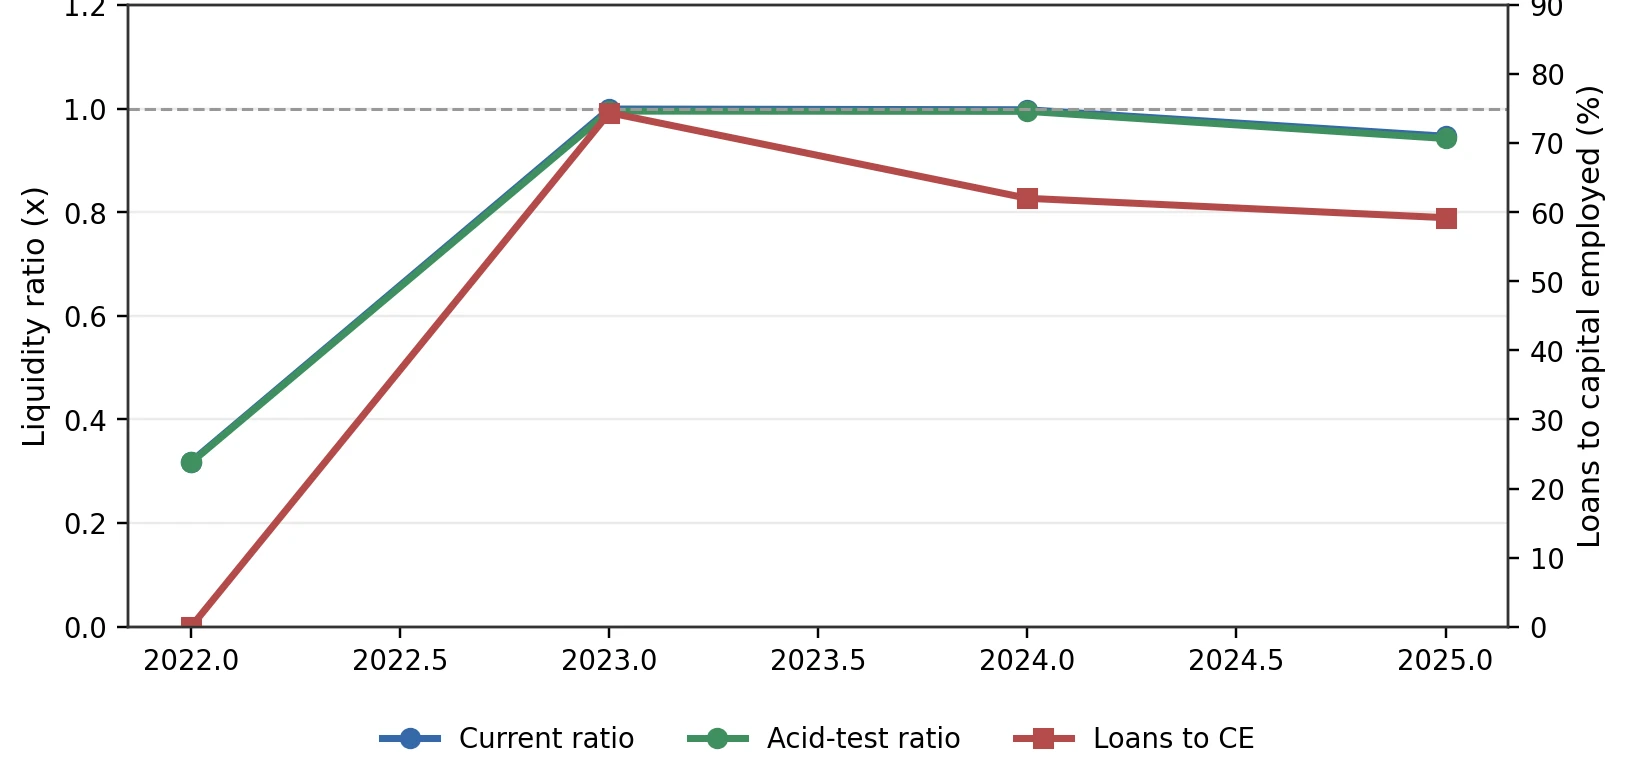
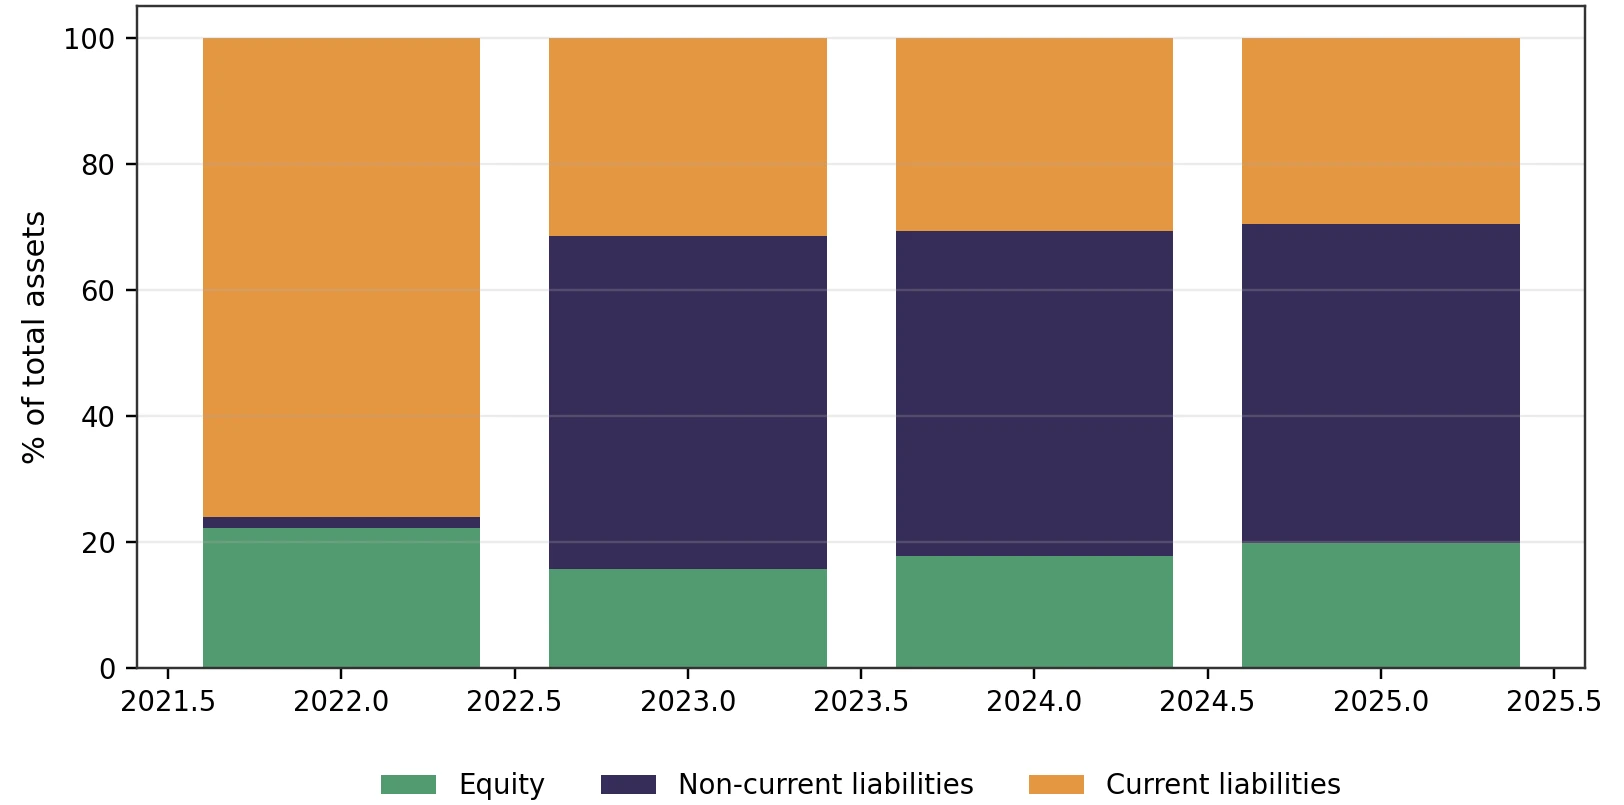
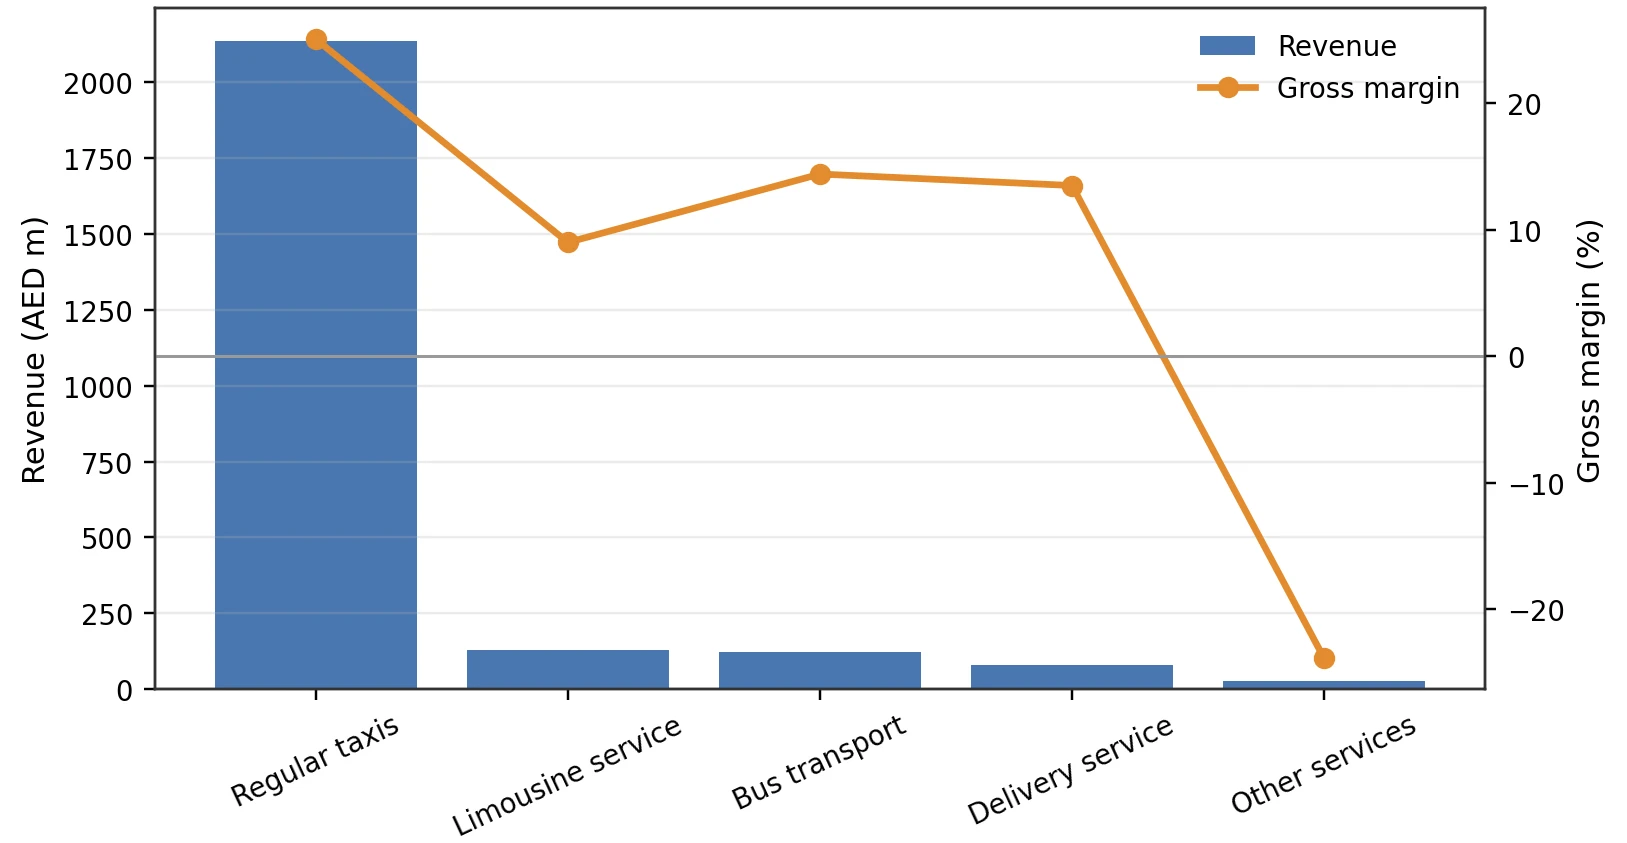
This analytical report evaluates Dubai Taxi Company across 2022–2025 using published financial-statement figures assembled in the source report. It combines profitability, efficiency, liquidity and gearing ratios with horizontal income-statement indices, vertical balance-sheet analysis and a ratio-based comparison with ComfortDelGro. Supporting workings document calculation choices, including the treatment of current assets, receivables and capital employed. The dashboard shows sustained revenue growth alongside pressure on net profit margin after 2023. It also makes visible the financing transition around the IPO period and the continued importance of leverage, cash generation and investment requirements. Segment analysis separates the regular taxi business from limousine, bus, delivery and other services, exposing differences that aggregate growth alone can hide. The report translates those observations into a proposed responsibility-accounting structure and balanced scorecard, connecting financial outcomes with utilization, service quality, safety and sustainability measures. This portfolio case demonstrates how tables and charts can support a coherent management briefing. Its figures and interpretations are those documented in the supplied report; the work does not establish that the proposed management controls were implemented.
The engineering challenge
Explain why strong revenue and operating returns can coexist with margin pressure and limited liquidity headroom, while separating core taxi performance from newer mobility segments.
Engineering approach
- Assemble four years of comparable income-statement, balance-sheet and cash-flow figures.
- Calculate profitability, efficiency, liquidity and gearing measures with documented assumptions.
- Use horizontal and vertical common-size analysis to reveal growth and funding shifts.
- Compare ratios with a mobility-sector peer and inspect segment-level performance.
- Propose responsibility centers and a balanced scorecard linked to financial and operational evidence.
Results & observations
Reported increase from AED 1,759.6 million in 2022 to AED 2,474.2 million in 2025.
2025 reported margin, compared with 17.7% in 2023.
2025 current assets divided by current liabilities under the report’s stated treatment.
2025 segment profit in the source report, identifying regular taxis as the principal profit contributor.
Features & capabilities
- Four-year financial dashboard
- Documented ratio workings
- Common-size analysis
- Peer comparison
- Business-unit performance review
- Proposed balanced scorecard
Software & engineering tools
Financial statement analysis, Ratio modelling, Common-size analysis, Comparative dashboards