Project brief
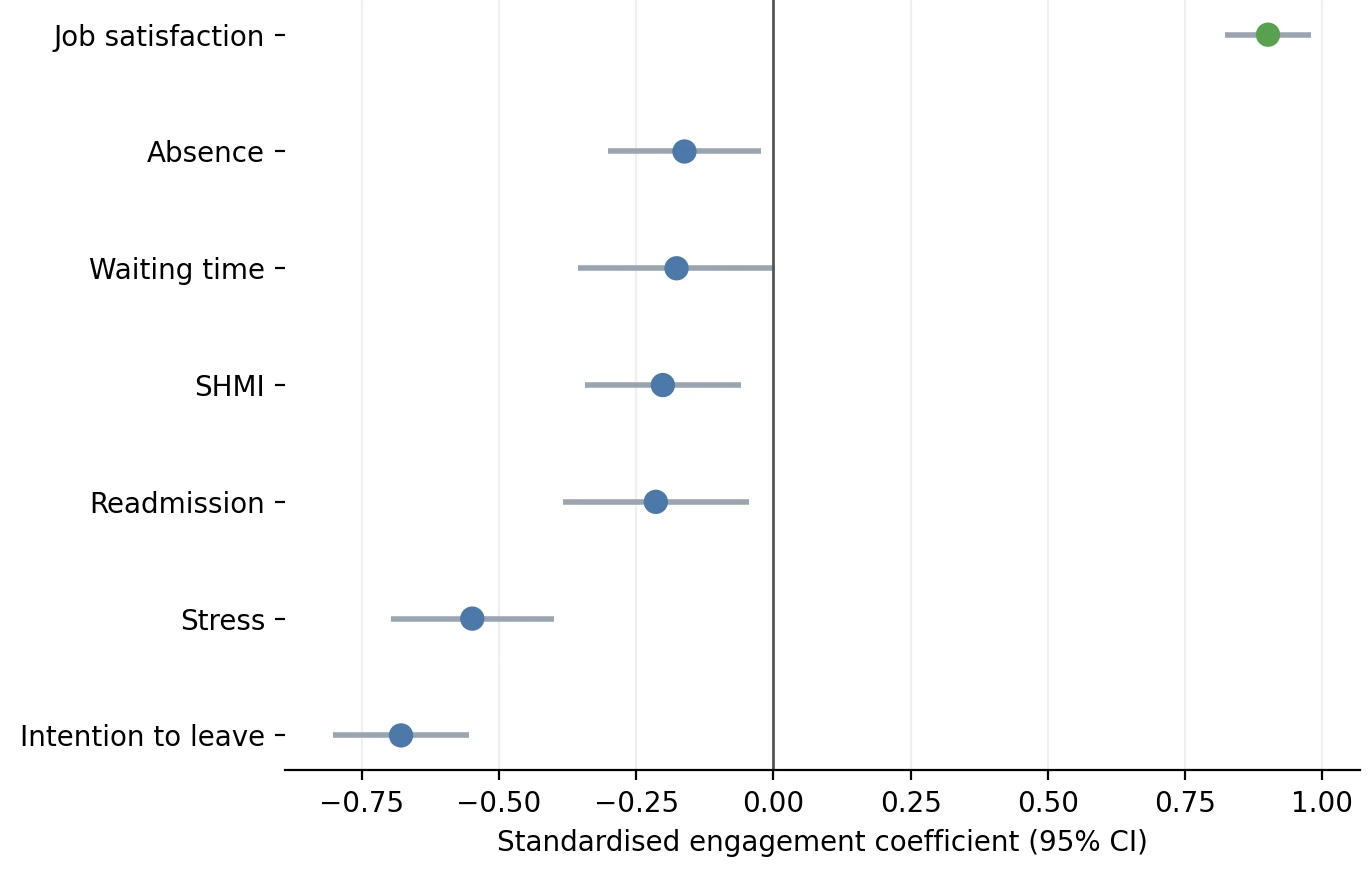
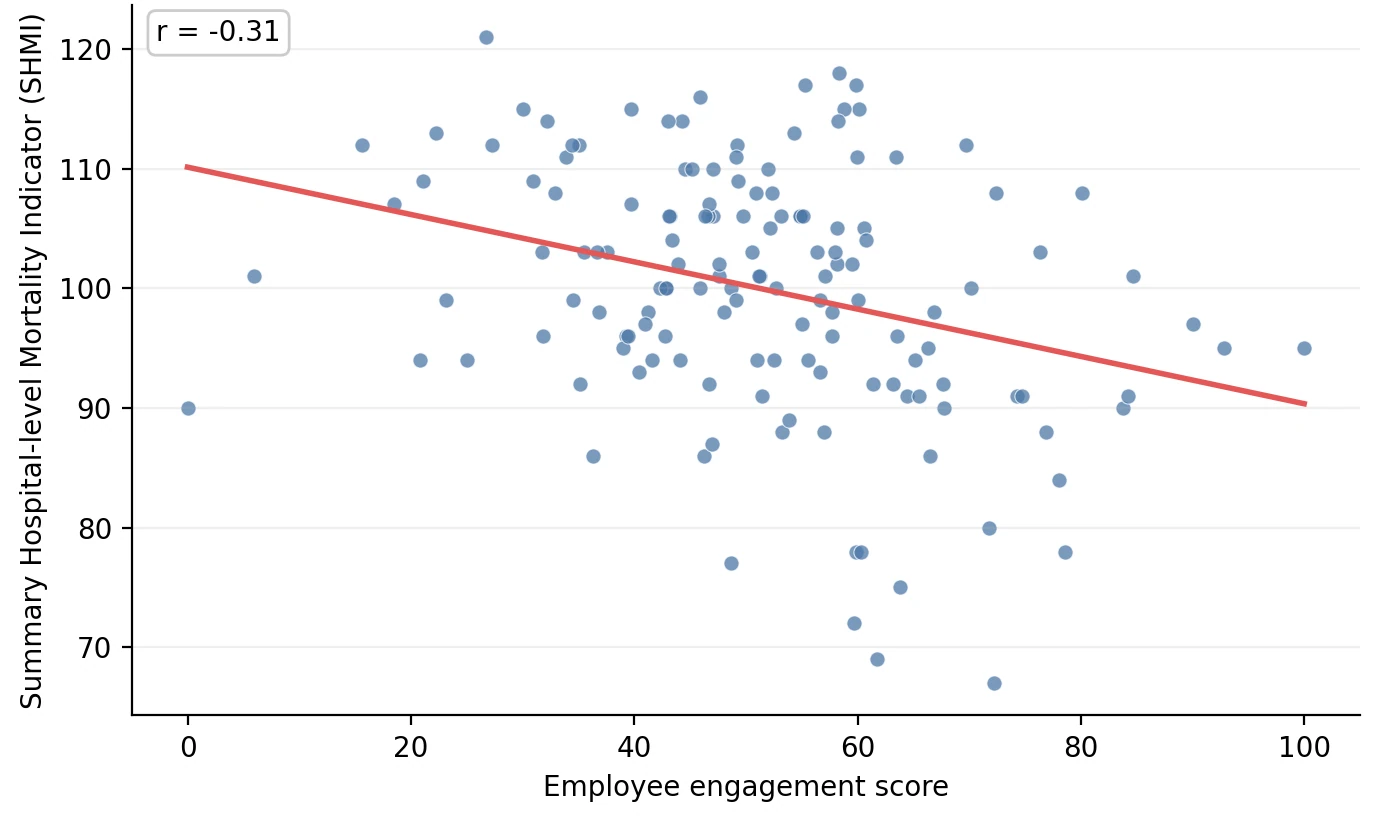
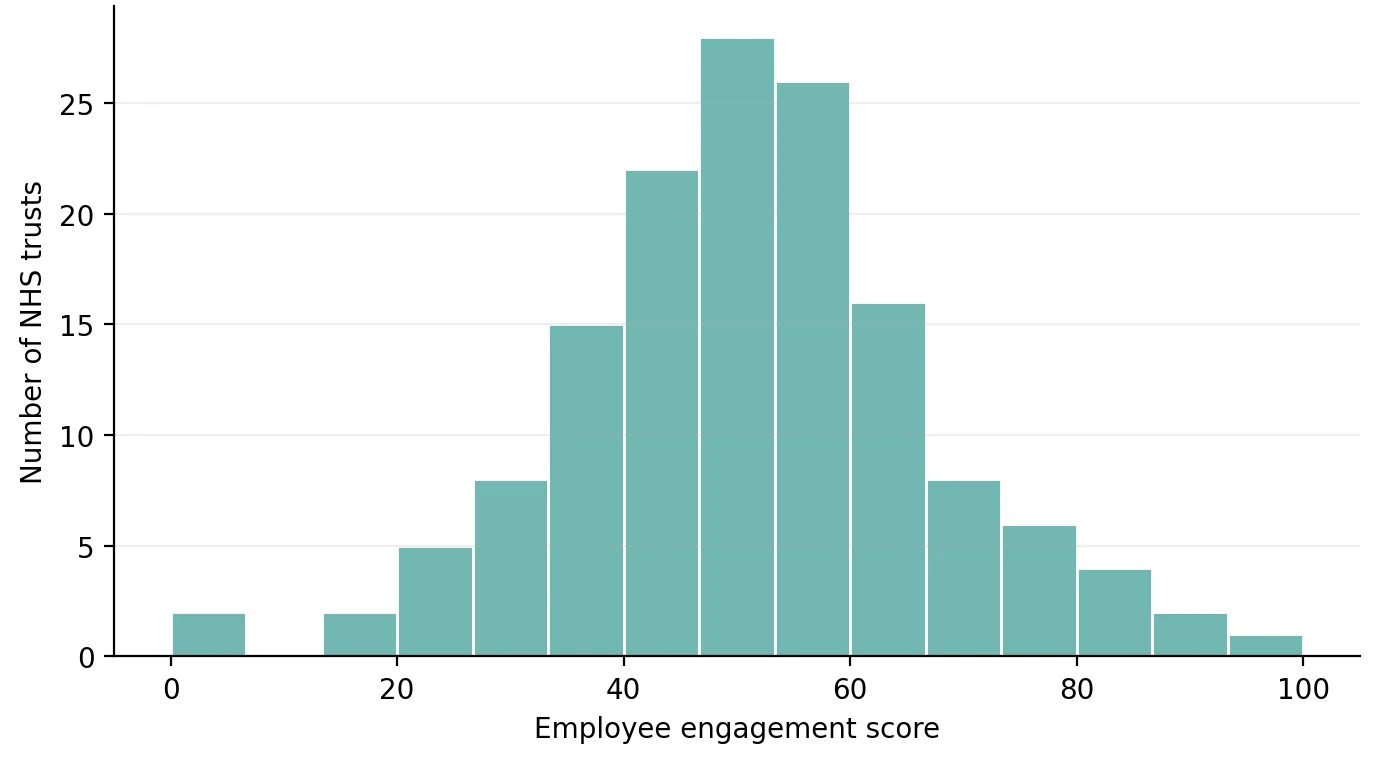
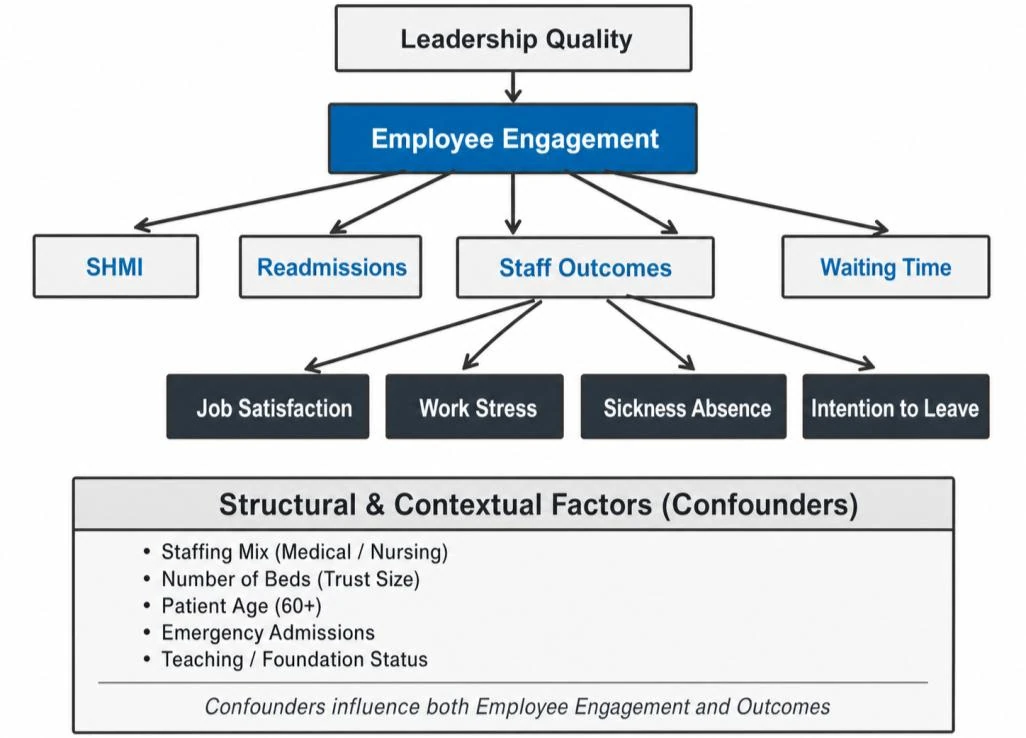
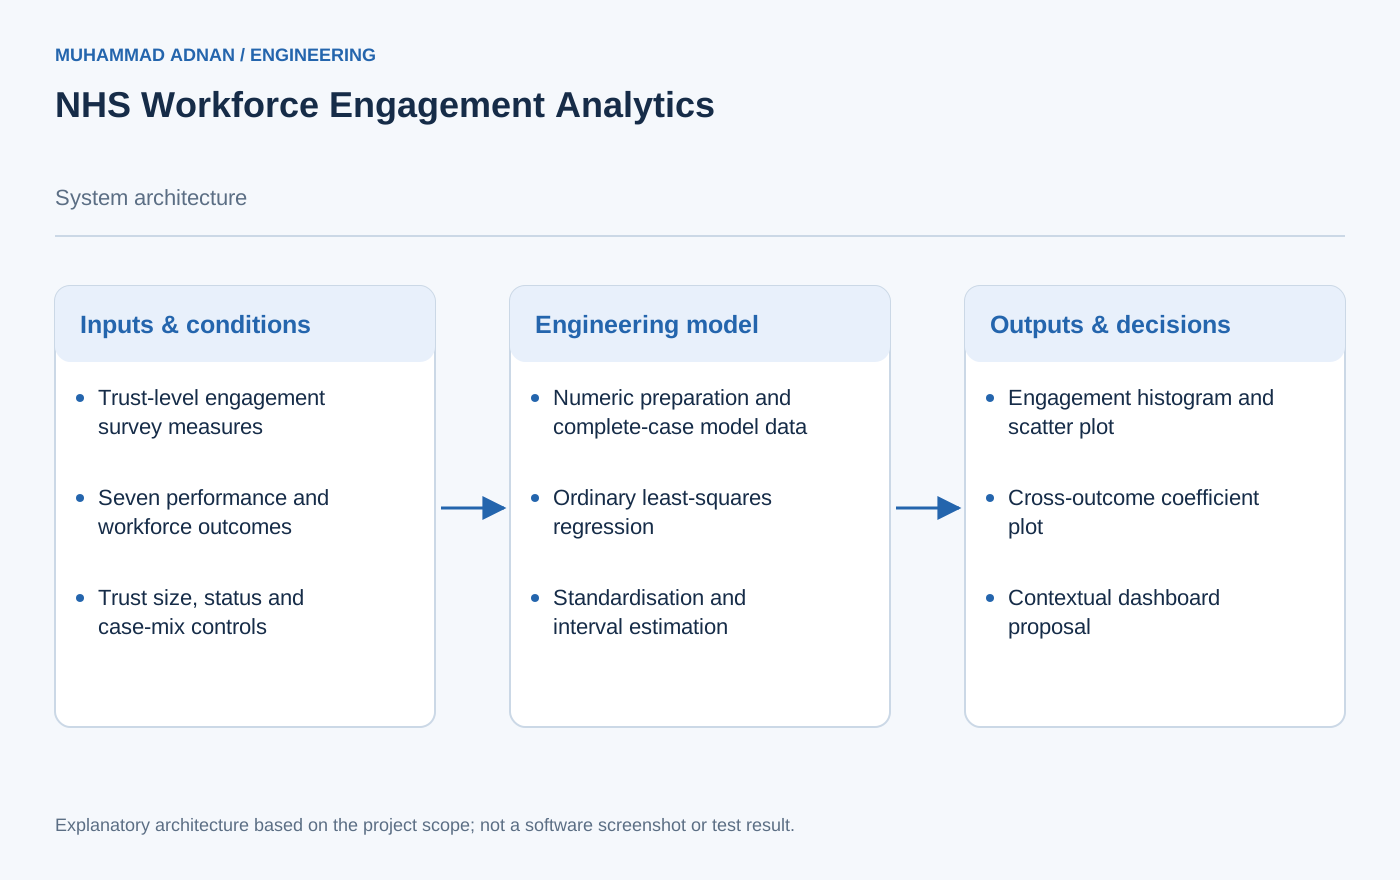
This people-analytics project examines how employee engagement relates to hospital performance and workforce experience across 145 NHS trusts in a 2016 workshop dataset. A documented R workflow imports the CSV, prepares model variables and produces report graphics with ggplot2. Descriptive analysis establishes the distribution of engagement, while a bivariate scatter plot examines its relationship with the Summary Hospital-level Mortality Indicator. The analysis then fits separate ordinary least-squares models for seven outcomes, controlling for trust status, size, staffing mix and patient characteristics. Standardised coefficients and confidence intervals make the associations comparable across outcomes with different scales. The strongest reported relationships concern job satisfaction, work-related stress and intention to leave. Associations with patient outcomes are more qualified, and waiting time has very little explained variation. A conceptual diagram places engagement within a wider organisational system, with leadership and structural conditions affecting both staff experience and performance. The project translates these findings into a proposed combined workforce dashboard and discusses how managers could use contextual indicators to investigate local problems. Its interpretation remains explicitly observational: the analysis supports prioritisation and further investigation, but does not establish that changing engagement scores will cause better clinical outcomes. The appendix provides visible code for data preparation, model fitting and chart export.
The engineering challenge
Compare outcomes measured on different scales while separating observable trust differences from engagement associations and avoiding causal claims from a single cross-section.
Engineering approach
- Import the trust-level CSV and prepare numeric variables in R.
- Describe engagement distribution and inspect the engagement–mortality relationship.
- Fit seven controlled linear regressions and obtain standardised coefficients with confidence intervals.
- Compare staff-experience, clinical and operational associations.
- Translate findings into a proposed contextual dashboard with human interpretation.
Results & observations
Trust-level workshop observations for England in 2016.
Mortality indicator, readmissions, waiting time, absence, satisfaction, stress and intention to leave.
Reported bivariate association; the controlled engagement coefficient is −0.128.
Highest reported model fit among the seven outcomes; engagement coefficient 0.170.
Features & capabilities
- R data-preparation code
- Seven controlled regression models
- Standardised effect comparison
- Confidence-interval visualisation
- Conceptual confounding model
- Dashboard and governance proposal
Software & engineering tools
R, ggplot2, Base R linear models, CSV data preparation