Project brief
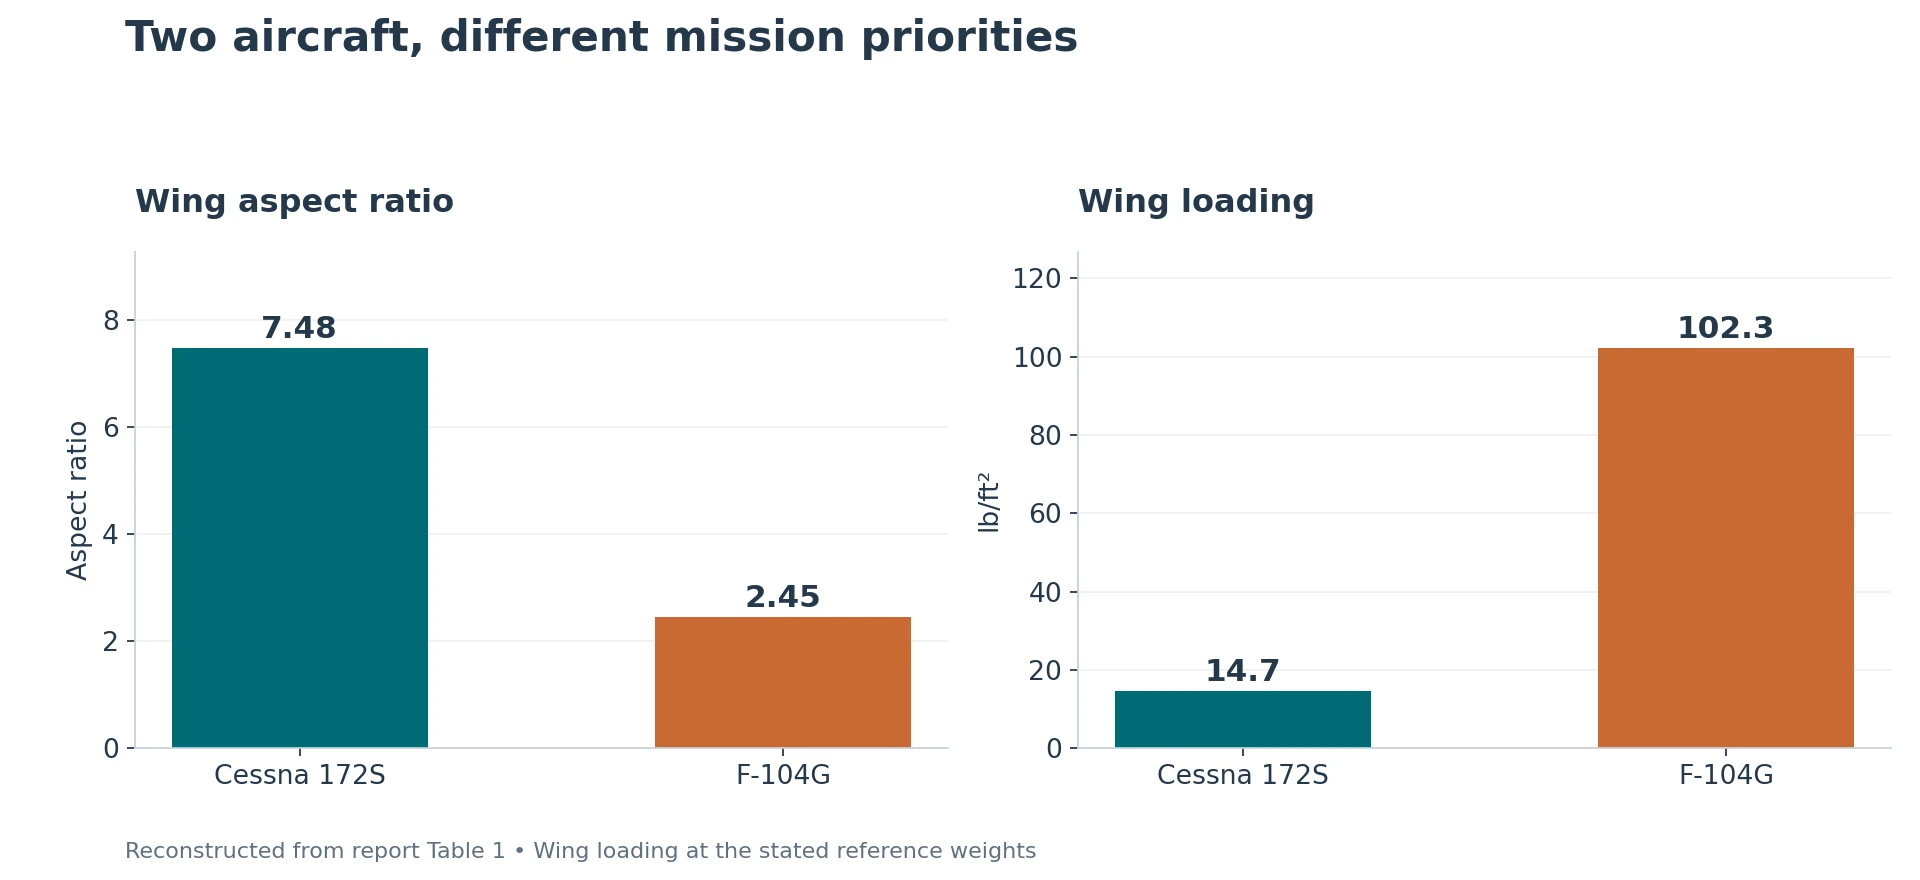
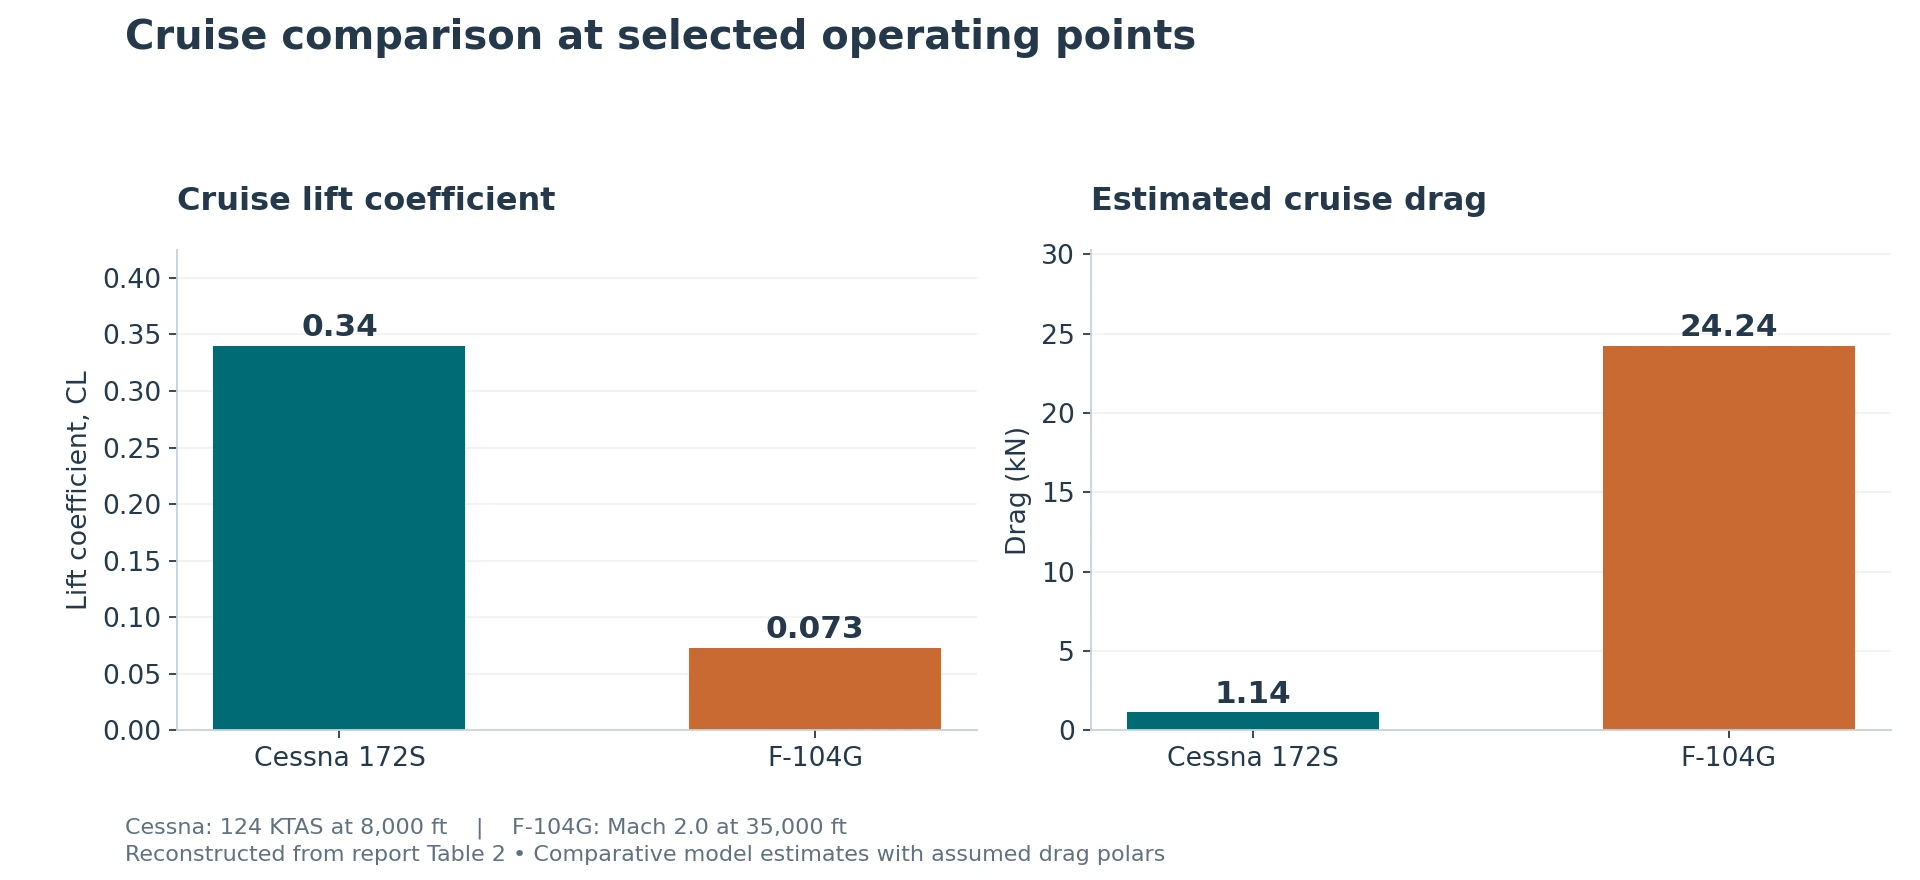
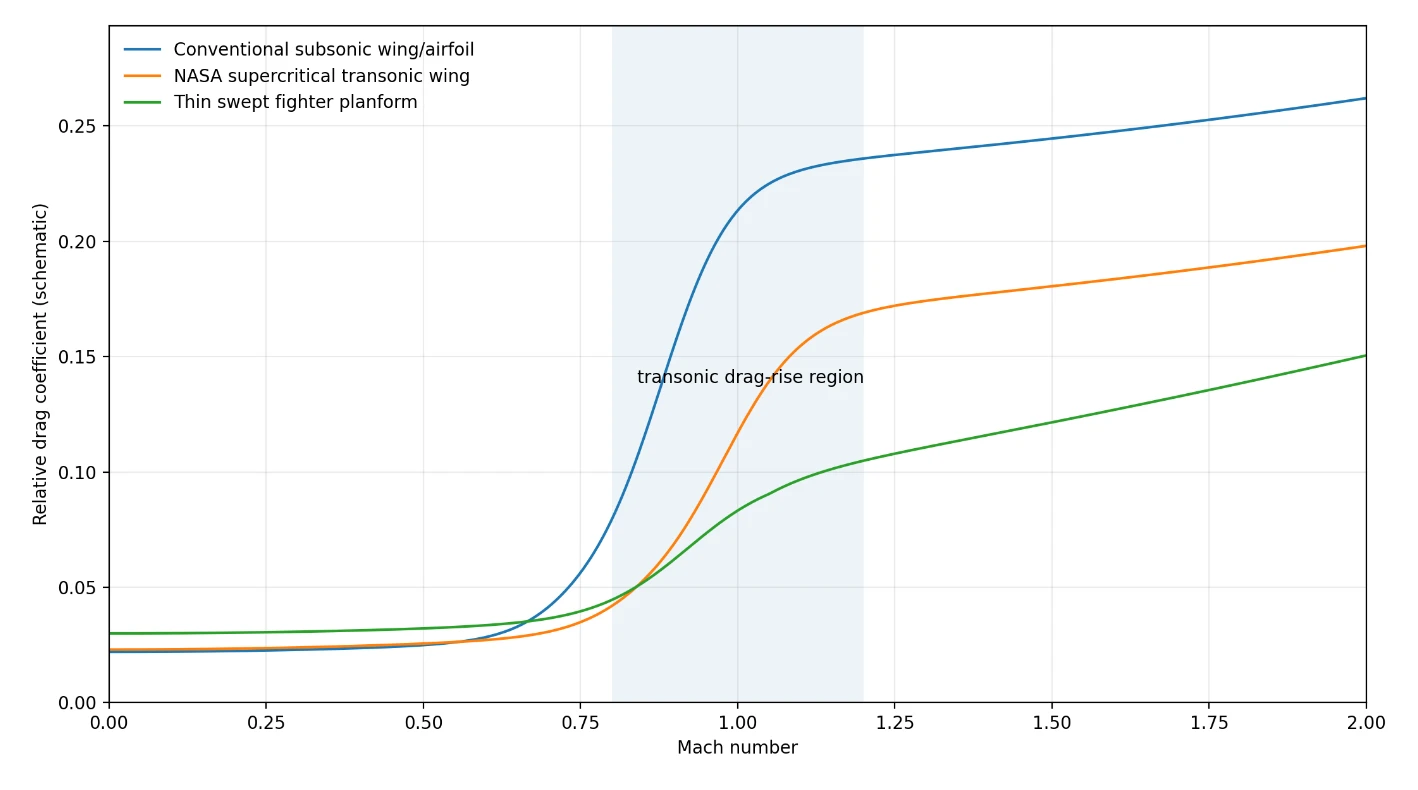
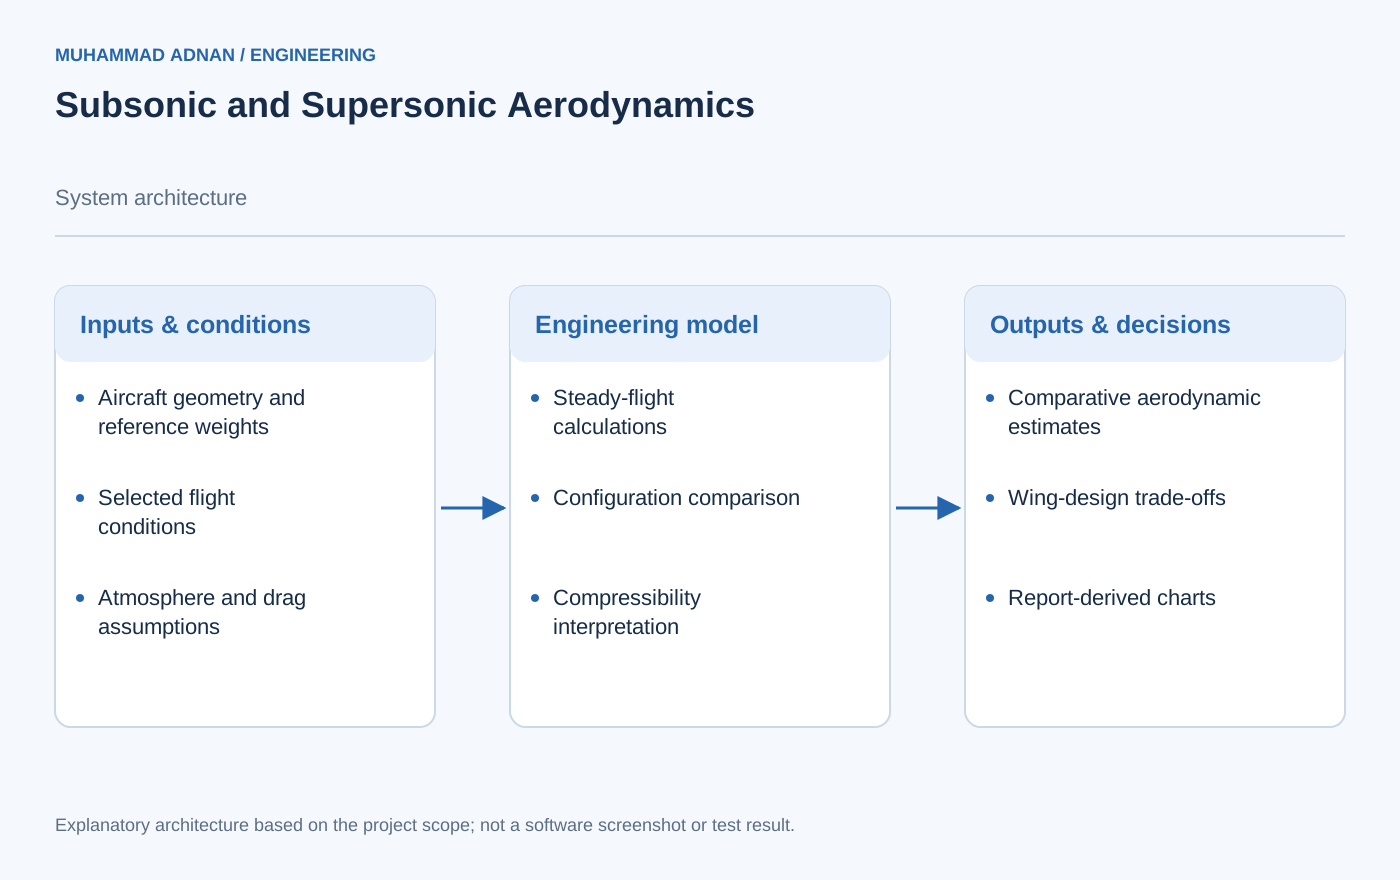
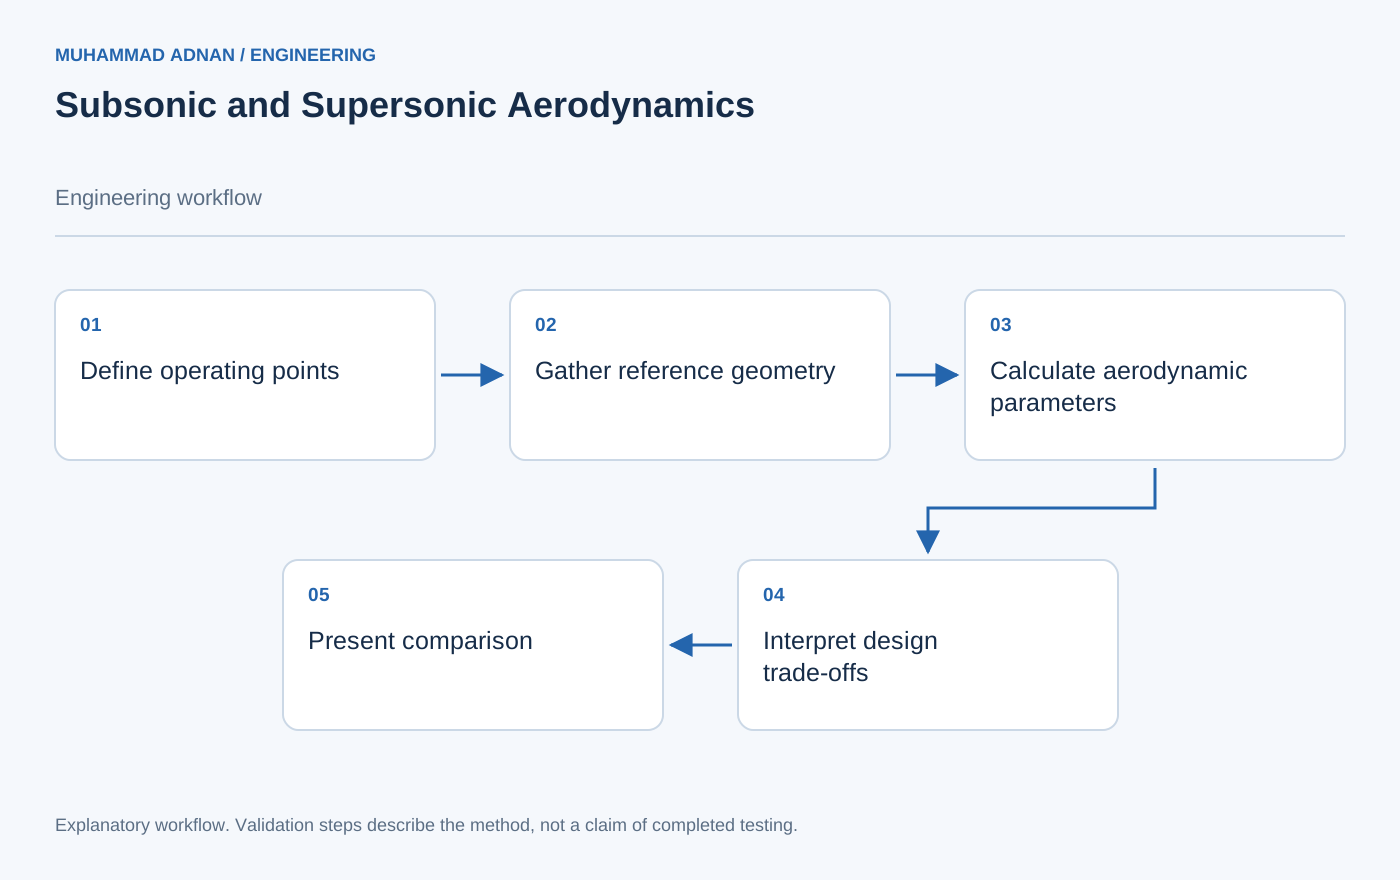
This study compares the Cessna 172S and Lockheed F-104G to examine how mission requirements shape aircraft geometry and operating performance. It brings together reference dimensions, representative weights, atmospheric conditions and selected take-off, landing and cruise points. The calculation method assumes steady flight, determines dynamic pressure and lift coefficient, and uses a simplified drag polar to estimate drag and lift-to-drag ratio. Because complete certified drag polars were unavailable in the report, the drag results are comparative engineering estimates with stated assumptions. The analysis connects the higher aspect ratio and lower wing loading of the trainer to its low-speed operating role, then considers the small, thin wing and high-speed specialization of the F-104G. A separate discussion addresses transonic drag rise, airfoil thickness, inlet design and high-lift devices. The portfolio visuals include the report’s generic drag-rise schematic and clearly identified charts reconstructed from its aircraft and cruise tables. The outcome is a structured explanation of aerodynamic trade-offs across two very different flight regimes, with the selected operating conditions kept visible alongside the results.
The engineering challenge
Compare aircraft designed for substantially different missions without treating simplified drag estimates as certified performance or ignoring their operating conditions.
Engineering approach
- Organized reference geometry, weights and selected flight conditions for both aircraft.
- Calculated dynamic pressure, lift coefficient, estimated drag and lift-to-drag ratio using a common steady-flight method.
- Applied explicit drag-polar and efficiency assumptions where complete reference data were unavailable.
- Related the numerical comparison to wing loading, aspect ratio, compressibility and high-lift design.
Results & observations
Report reference value at 2,550 lb.
Report reference value at 20,066 lb.
Report calculation at 124 KTAS and 8,000 ft.
Report calculation at Mach 2.0 and 35,000 ft.
Features & capabilities
- Steady-flight calculation framework
- Selected take-off, landing and cruise comparison
- Wing-loading and aspect-ratio analysis
- Compressibility and drag-rise discussion
- Explicit modelling assumptions
Software & engineering tools
Engineering calculations, ISA atmospheric data, Comparative drag-polar model